8,526 priced pull requests: code size doesn’t track the money
I tested the usual ways of counting AI coding output (PRs, lines of code, how long code survives) against 8,526 code changes a company actually paid for. They barely track the price, and survival doesn’t predict later bugs.
At the end of my last post, Only the denominator, I proposed a yardstick: count code as a unit of output only if it isn’t reverted or heavily rewritten within N months of merging. Then I said it had to be tested before anyone could claim it reflects real value.
I nearly skipped that step myself. I had already used the yardstick to compare how long code written with Opus and with Sonnet survived across 20 open-source repositories, and was about to scale up to 300. Before scaling up, I tested it, along with a few other common measures, against public data with real prices attached.
The result: counting PRs, counting lines of code and measuring how long code survives all barely track what was actually paid. And code that survives longer is no better at predicting which changes will later turn out to have caused bugs.
Data where every change has a price
Vendors that sell “cost per merged PR” mostly start their numerator from PRs: Jellyfish counts merged PRs, and Larridin weights them by complexity and quality.[1][2] Testing a numerator like that needs an independent judgment expressed in money. Public data of that kind is rare.
Expensify’s expense app is open source. Much of the work goes to outside developers, who are paid per issue. The price is in the issue title, and payment is made seven days after the code ships.[3] OpenAI’s SWE-Lancer benchmark scores models on the same data.[4] When a bug is fixed, Expensify’s process also asks for a checklist that names the PR that introduced it.
I took 8,526 PRs merged between November 2021 and June 2026, each of which fixed exactly one priced issue. For each PR I computed a few numerators: lines of code added, files changed, lines still present 90 days after merging, and the share of lines still present.
Before running anything, I set the cutoffs: a correlation with price below 0.1 means essentially unrelated; 0.3 or above counts as support.
Code size doesn’t track the price
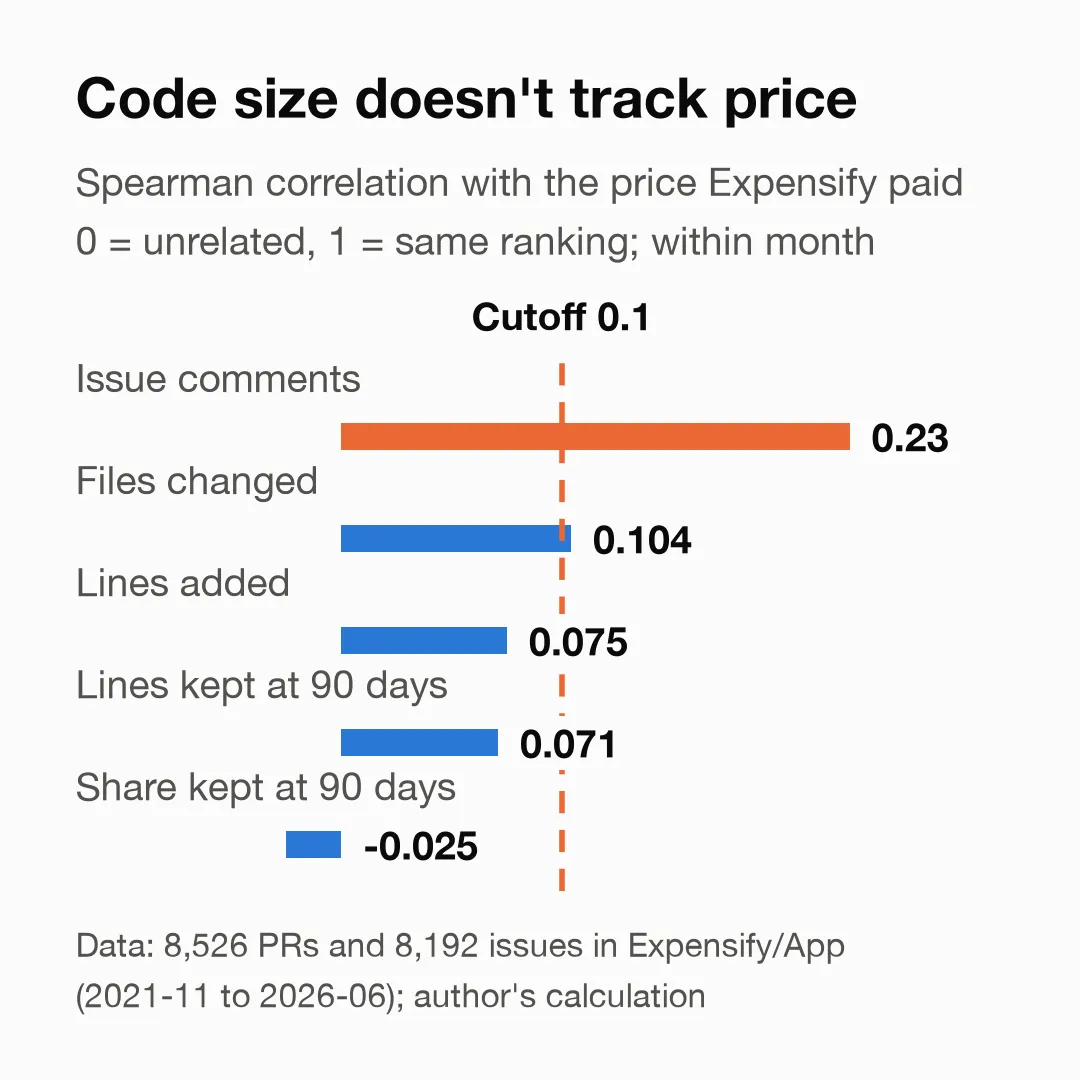
I used Spearman correlation, which asks whether two things rank items in the same order: 0 means unrelated, 1 means the same ranking. Expensify sets prices by period, and in any given month 75% to 90% of PRs carry that month’s default price, so I compared PRs within the same month and then pooled the results.
Lines added: 0.075. Lines still present after 90 days: 0.071. Share still present: −0.025. Only files changed cleared the cutoff, barely, at 0.104.
Counting PRs is cruder still. The 90th percentile of price is four times the 10th, and every PR counts as one.
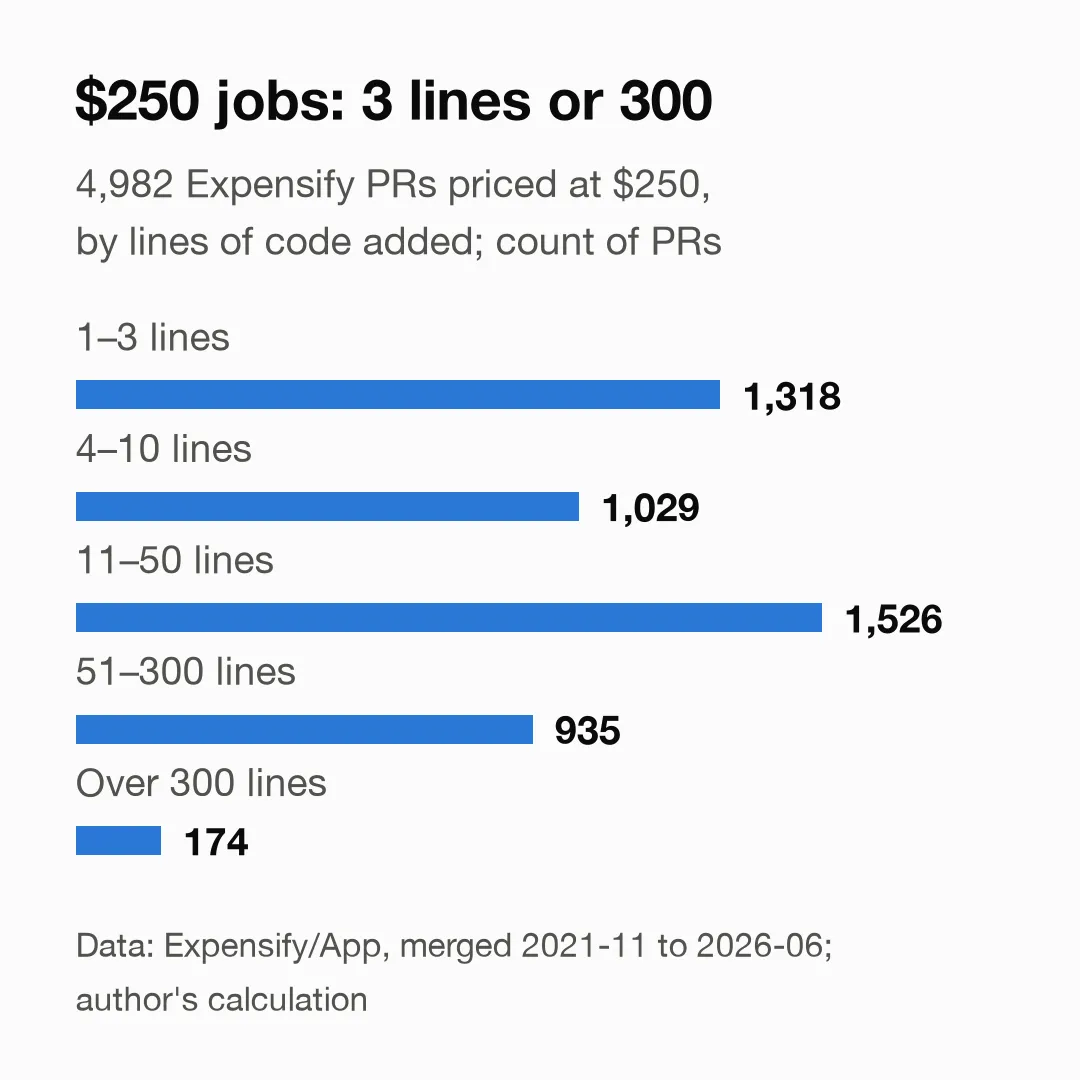
Look at it the other way, at a single price. Of 4,982 PRs priced at $250, a quarter added three lines of code or fewer, the median added 12, and 174 added more than 300.
Survival doesn’t predict later bugs
The idea behind survival is that good code lasts and bad code gets rewritten quickly. Expensify’s checklists make that testable.
Of 2,982 PRs merged between January 2025 and March 2026, 55 were named as the source of a bug more than 90 days after merging. I only used bugs reported after 90 days: fixing a bug rewrites the original code, so a bug reported within 90 days would pull survival down directly, and the test would be checking the result against itself.
I used 90-day survival to separate those 55 PRs from the rest, within four size bands. The AUC ranged from 0.40 to 0.54; an AUC of 0.5 is a coin flip. In three of the four bands it was below 0.5, meaning the PRs later blamed for bugs survived slightly better. Every confidence interval includes 0.5, so there’s no direction to report, only that survival can’t tell them apart.
One possible reason is that nobody touches code nobody uses. According to a 2012 study of a business system at a reinsurance company, 40.7% of the methods that ran in production were later modified, against 8.3% of methods that never ran.[5] By the survival measure, dead code lasts longest.
The information is in the issue, not the code
Maybe the price is just noise and nothing would match it. To rule that out, I looked at 12 signals on the issue side.
The strongest was the number of comments on the issue, at 0.23, followed by the length of the issue description at 0.16 and the number of people who proposed a fix at 0.13. All of them beat the code side. Part of the comment count is mechanical, since bots post reminders and price increases, and the longer an issue stays open, the more of them there are. Among issues whose price never went up, it falls to 0.14, while description length and proposal count barely change.
So the price does carry information that can be read off the record, just not from the code. And not much of it: fitting all 12 signals on an earlier period and testing on the following 6,614 issues gave a correlation of only 0.165.
What this data can’t show
Price isn’t value. It reflects how urgent and how hard Expensify judged the problem, and how long it went unsolved, not what the fix was worth to the business.
This is one company and one front-end project. Since 2025, pricing has been nearly flat, with close to 90% of jobs at $250. Comparing within months means I am really using the PRs that deviate from the default price. In 2022 to 2024, when prices still came in tiers, the correlation for lines of code was 0.032, the same conclusion.
I only tested the crudest numerators. I didn’t test numerators weighted by complexity and quality, like Larridin’s, because its scoring model isn’t public.
Bug labels are sparse. A PR that was never named may still have caused a bug.
So the conclusion only goes this far: these numerators failed the first test. That doesn’t mean they are useless, and it says nothing about every possible numerator. As for comparing Opus and Sonnet across those 20 repositories, I’m not scaling it up for now. It isn’t clear what the yardstick measures, so any difference it finds can’t say which model is worth more.
If you use a “cost per merged PR” dashboard, you can run the same check. Take any independent judgment you already have, such as effort estimates, priorities or the PRs blamed in incident reviews, and compare it with the dashboard’s numerator.
Sources
- Jellyfish, Nicholas Arcolano, 2026-04-15, Is “tokenmaxxing” cost effective? New data from Jellyfish explains.
- Larridin, AI coding benchmark data, four weeks to 2026-08-02.
- Expensify/App repository, contributor guides and bounty issues, accessed 2026-10-03. The correlations and AUCs in this post are my own calculations from the repository’s public records.
- OpenAI, Samuel Miserendino et al., 2025-02-17, SWE-Lancer: Can Frontier LLMs Earn $1 Million from Real-World Freelance Software Engineering?, arXiv 2502.12115.
- Sebastian Eder, Maximilian Junker, Elmar Jürgens et al., ICSE 2012, How Much Does Unused Code Matter for Maintenance?.