Only the denominator: why spend caps are the one tool left for AI costs
Companies cap each employee’s AI spend because no one can yet say what the output is worth; vendors measure it differently and nobody has checked them, and the people most worth measuring are the heavy users the caps bind.
In April 2026, The Information reported that Uber’s CTO said the company had used up its full-year AI budget in four months.[1] In June, an Uber spokesperson told Bloomberg that the company had capped AI coding tools such as Claude Code and Cursor at $1,500 per employee, per tool, per month.[2]
That number answers “how much can we spend?” It doesn’t answer “what did the money buy?” Giving everyone the same cap assumes that heavy use is waste.
My read is that companies manage this way because they can’t yet answer the second question. They can track spend down to each person and each day, but there is no agreed method for valuing what that spend produces.
The bill changed
AI coding tools used to be sold per seat: a fixed price per person per month, and extra use cost nothing. The only decision was whether to buy.
Now more and more tools bill by the token. The more you use, the more you pay.
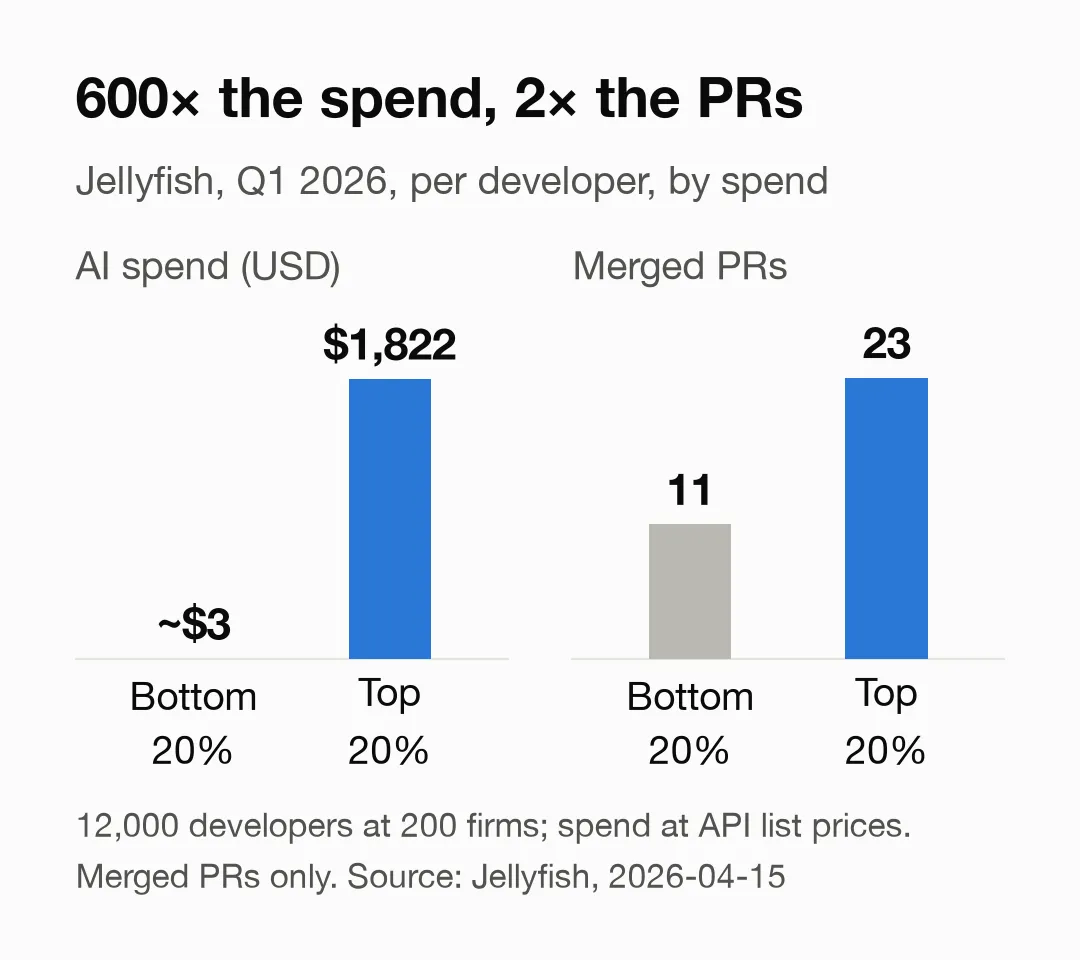
Jellyfish looked at Q1 2026 data from about 12,000 developers at 200 companies. The lowest-spending 20% spent about $3 over the quarter; the highest-spending 20% spent $1,822, roughly 600 times as much.[3] Fortune reported that an internal Accenture analysis found usage of one AI tool rose 113-fold in 10 weeks, with 19% of users accounting for about 80% of the spend.[4]
Only the denominator is visible
Write the value of AI as a fraction: the numerator is the output, the denominator is the money spent.
The denominator is measured in detail. Claude Code’s spend report shows estimated spend per user and per model, updated daily.[5]
Few companies can say what the numerator is. One approach is a survey: DX asks engineers to report regularly how much time they saved, and the average is 3.9 hours a week.[6]
METR ran a randomized controlled trial. Sixteen experienced open-source developers worked on 246 real tasks, and each task was randomly assigned to allow or disallow AI. With AI allowed, they took 19% longer, yet afterwards they believed they had been 20% faster.[7] Those were early-2025 tools. In February 2026, METR said the speedup is probably larger now, but its new data is too weak to say by how much; it also repeated that developers’ self-reported speedups can be quite unreliable.[8]
Without a numerator, management can only work on the denominator. Between June and September 2026, GitHub Copilot, OpenAI and Anthropic each launched or extended per-person spend caps in their enterprise plans, with a request-and-approve flow for employees who hit their cap.[9]
The assumption behind a cap
A cap only binds the heaviest users. Capping all of them the same way assumes that heavy use is probably waste.
That may be right. Heavy use does include waste, such as an agent going in circles, or the most expensive model doing the simplest work.
It may also be wrong. Heavy users may be the people who are best at using AI and doing the hardest work. Capping them could save far less than the output it costs.
A cap won’t tell you which case is more common. Even the budgets are often guesses: in a Harness survey published in June 2026, 56% of 700 technology decision-makers and managers at companies with more than 1,000 employees said AI budgeting is guesswork.[10]
One objection is that AI coding tools aren’t expensive to begin with. Claude Code’s documentation puts the average enterprise developer at $150 to $250 a month.[5] Against a rough fully loaded cost of $200,000 a year for a US engineer, that is 1% to 1.5%: not worth tracking person by person.
For the typical user, that holds. For them, tokens are a rounding error; the expensive part is the time people spend briefing the agent, checking its work and redoing it, and that time isn’t on the bill. OpenAI’s SWE-Lancer paper, published in February 2025, had GPT-4o and o1 work on real programming tasks from a freelance platform. API costs came to just 0.08% to 0.7% of what the freelancers were paid. But letting the model try once and paying a freelancer to redo the tasks it failed saved only 9% to 13% in total.[11] That doesn’t count the time spent checking the results. Those were early-2025 models, and the paper itself says newer models should save more. For typical users, a rough estimate is enough, and caps don’t reach them anyway.
The people caps do bind are different. Larridin, a company that analyzes AI spend, looked at engineers who are billed by usage and merge code. The median spent about $920 a month, the top quarter more than about $2,100, and the top tenth more than about $3,900.[12] Against the same $200,000, the median comes to about 5.5% and the top tenth to about 24%: tokens are no longer a rounding error. Uber’s $1,500 cap falls between the median and the top quarter. Whether that group’s spend is worth it is exactly the question.
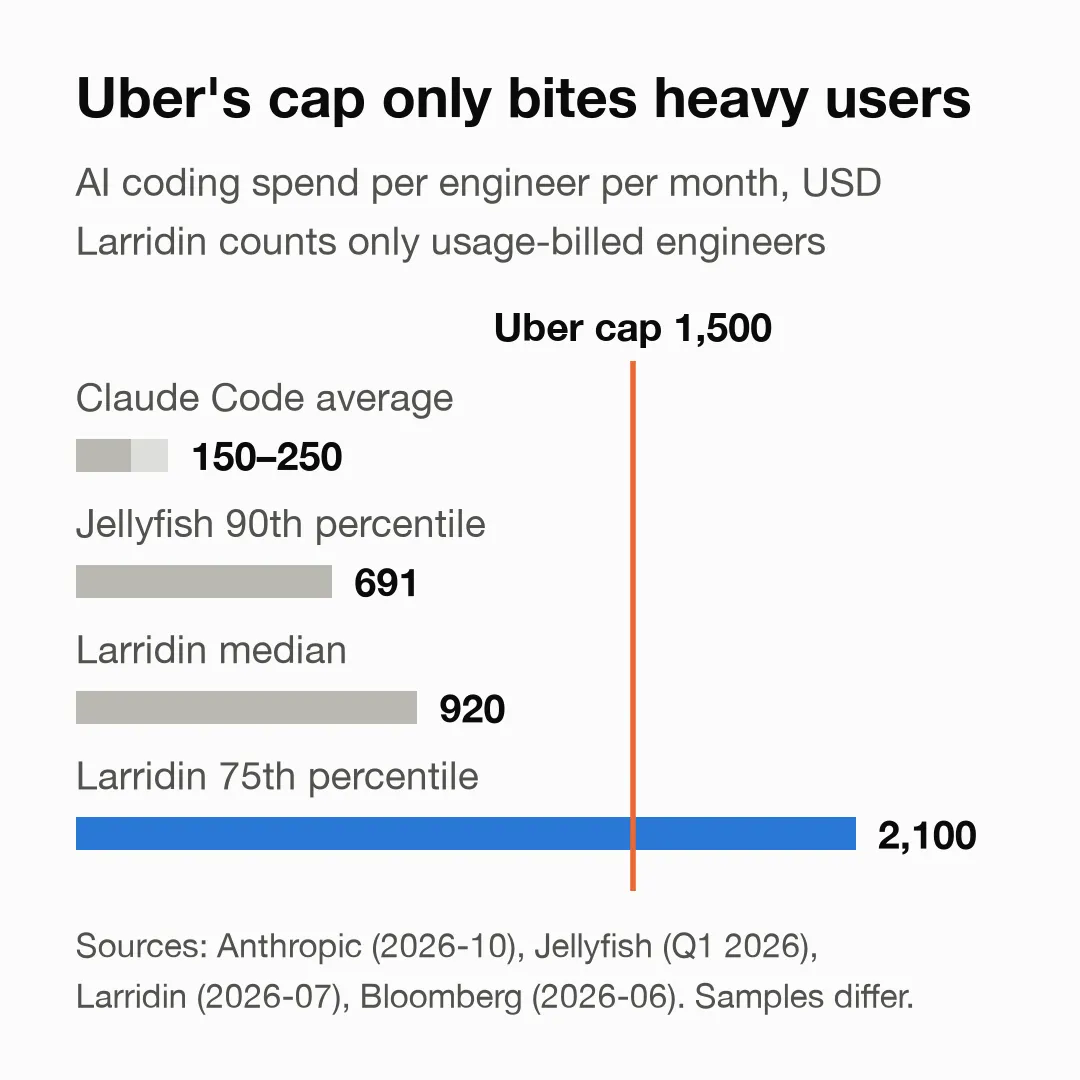
A cap may also just be a way to make the budget predictable. Even then, it trades the output that gets cut for predictability. Whether that trade is worth it depends on what the output is worth.
Vendors now sell a numerator, each measured differently
Several companies now sell a “numerator”, each with its own method:
| Company | How it measures the numerator | How much of the method is public | What it says about heavy spend |
|---|---|---|---|
| Jellyfish [3] | Number of merged PRs (pull requests) | Public; spend estimated at public API prices | Looks like diminishing returns |
| Larridin [12] | Merged PRs, scored for complexity by a model, then discounted for quality | Partly; how the model scores is not public | Depends on the group: in one, output looks like it rises with spend; in the other, returns halve past a point |
| Ascerta [13] | How engineers use AI; calls PR counts a “vanity metric” | How “productivity” is calculated is not public | No public figures found |
| Faros [14] | Sorts token-consuming sessions into effective, inefficient and wasteful, then recommends keeping, narrowing or cutting each tool | Classification method not public | No public figures found |
Different methods, and conclusions that don’t line up.
In Jellyfish’s data, the top and bottom 20% of spenders differ about 600-fold in spend, but merged PRs only double: 23 versus 11 in a quarter. Cost per merged PR ranges from $0.28 in the lowest-spending tier to $89.32 in the highest.[3] That looks like steep diminishing returns.
Larridin compared two groups of engineers at the same company. In the group that uses AI most heavily, engineers spending about $1,300 a week produced 11.8 times the complexity-weighted output of the group’s lowest-spending tier: more spend, more output, at least on the surface. In the less AI-heavy group, the marginal return fell by about half once weekly spend passed about $600.[12]
The two don’t directly contradict each other. Jellyfish’s data comes from 200 companies and Larridin’s two groups from one, and they group engineers and measure output differently. Change the methodology and the conclusion changes with it.
Both sets of numbers are also only correlations. Larridin itself says causality may run the other way: high-output engineers may spend more because they ship more.[12] Jellyfish doesn’t rule out another explanation either: heavy spenders may simply be doing harder, larger work.
What’s missing: a methodology and an audit
Financial statements are trusted because of two things. One is an agreed methodology that defines what counts as revenue, when it is recognized and how assets depreciate. The other is an independent audit that checks the numbers follow it.
AI output has neither. The Linux Foundation only launched the Tokenomics Foundation in August 2026, to define how the value and ROI of AI are measured.[15] The vendors selling a numerator each use their own methodology. The four in the table either measure crudely, by counting PRs, or don’t fully disclose how they measure. None of them has shown evidence that its numerator tracks real value.
An audit is further off still. All the numbers above were published by the companies selling the numerator, from their own data and with their own methods. Even once a methodology is agreed, someone independent still has to check it. The denominator needs getting right too: besides tokens, it should include the human time they generate, such as checking and rework, which isn’t on the bill.
Several problems that accounting has already dealt with show up here:
- What counts as one unit of output? (unit of measure)
- When a person and AI produce something together, how much of the engineer’s salary should be allocated to it? (cost allocation)
- The value of tokens spent today may only become clear months later. Should they be expensed in the period, or capitalized and amortized, like some software development costs? (capitalization)
- What is code that was merged and then reverted three months later? (impairment)
Customer service already has one answer to the first question. Zendesk’s AI is priced by outcome: $1.50 per automated resolution, and a ticket only counts as resolved if the customer doesn’t reopen it within 72 hours of closing.[16] Code could be defined the same way: a unit of output is code that isn’t reverted or heavily rewritten within N months of merging. But like the numerators above, this yardstick has to be tested before anyone can say it reflects real value.
If you manage an AI budget: how did you set your caps? How do you tell whether someone’s heavy use is worth it or waste?
Sources
- The Information, Laura Bratton, 2026-04-14, Uber CTO Shows How Claude Code Can Blow Up AI Budgets. Paywalled; “four months” and “the CTO said” are as reported by TechCrunch on 2026-06-02.
- Bloomberg, Natalie Lung, 2026-06-02, Uber Caps Usage of AI Tools Like Claude Code to Manage Costs.
- Jellyfish, Nicholas Arcolano, 2026-04-15, Is “tokenmaxxing” cost effective? New data from Jellyfish explains. Costs estimated at public Claude API prices.
- Fortune, Sheryl Estrada, 2026-07-29, CFOs are hitting a ‘cost wall’ on AI.
- Claude Code docs, Manage costs effectively, accessed 2026-10-02.
- DX, 2026-05-19, How to measure AI performance in software engineering.
- METR, 2025-07-10, Measuring the Impact of Early-2025 AI on Experienced Open-Source Developer Productivity.
- METR, 2026-02-24, We are Changing our Developer Productivity Experiment Design.
- Vendor announcements:
- GitHub, 2026-06-01, Updates to GitHub Copilot billing and plans.
- GitHub, 2026-09-16, Copilot budget increase requests are generally available.
- OpenAI, 2026-06, New usage analytics and updated spend controls for enterprises.
- Anthropic, 2026-07-02, Giving admins more visibility and control over Claude spend.
- Harness, 2026-06, 2026 State of AI in FinOps.
- OpenAI, Samuel Miserendino et al., 2025-02-17, SWE-Lancer: Can Frontier LLMs Earn $1 Million from Real-World Freelance Software Engineering?, arXiv 2502.12115.
- Larridin, AI coding benchmark data, four weeks to 2026-08-02.
- Ascerta, Forge product page.
- Faros AI, Token Intelligence product page.
- Linux Foundation, 2026-08-04, Linux Foundation Launches the Tokenomics Foundation to Define the Economics and ROI of AI Value.
- Zendesk, outcome-based pricing overview, accessed 2026-10-02.